Features:
- Static Meshes: 12
- Material Instance: 12
- Material: 19
- Texture: 33
- DataAsset: 7
- Structure: 2
- Number of Blueprints:7
- Copy Network: (none)
- Windows Support: (yes)
特征:
- 静态网格:12
- 材料实例:12
- 材料:19
- 质地:33
- 数据集:7
- 结构:2
- 蓝图数目:7
- 复制网络:(无)
- Windows支持:(是)

[Demo video vimeo] [Demo video bilibili] [Product Documentation]
Note: The text in the asset uses the engine “Text3D” plug-in. This plug-in must be turned on, otherwise an error will be reported and cannot be used normally. It is recommended to enable the plug-in first and then import the assets into your project.
Make sure enabled project setting –>Substrate Materials, Substete opaque material rough refraction Substrate advanced visualization shaders.if not,the material is useless.
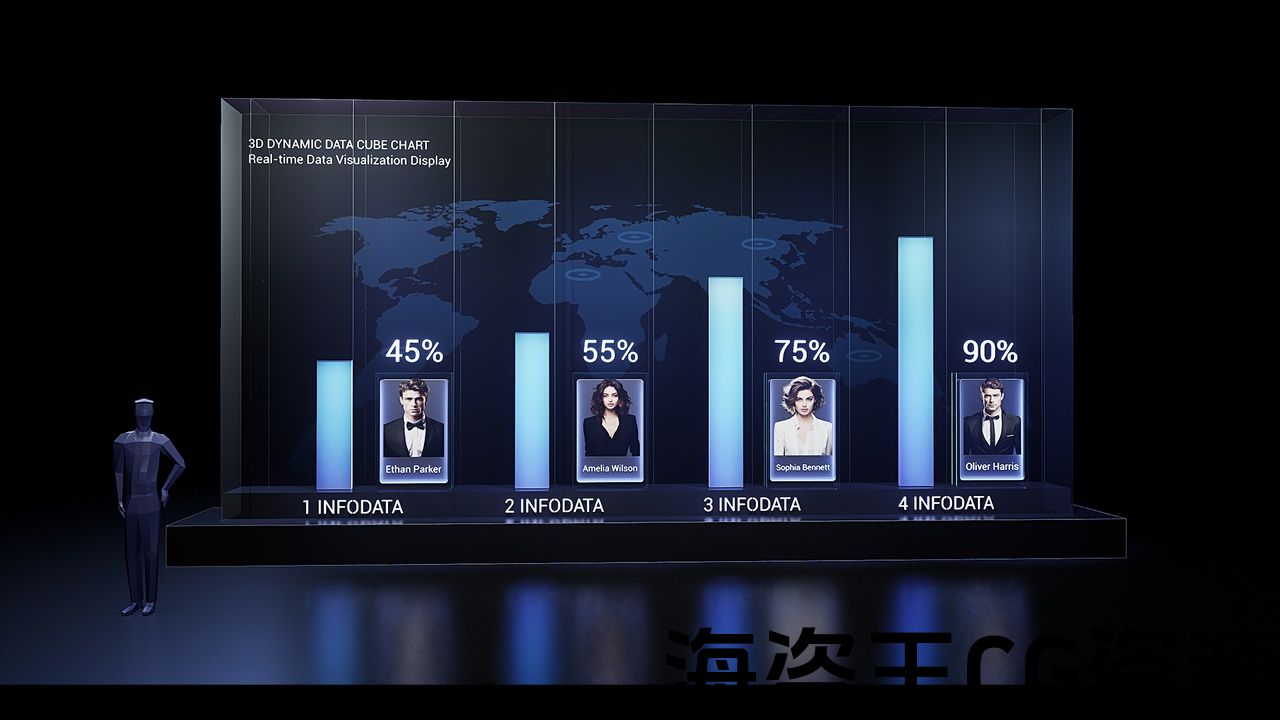
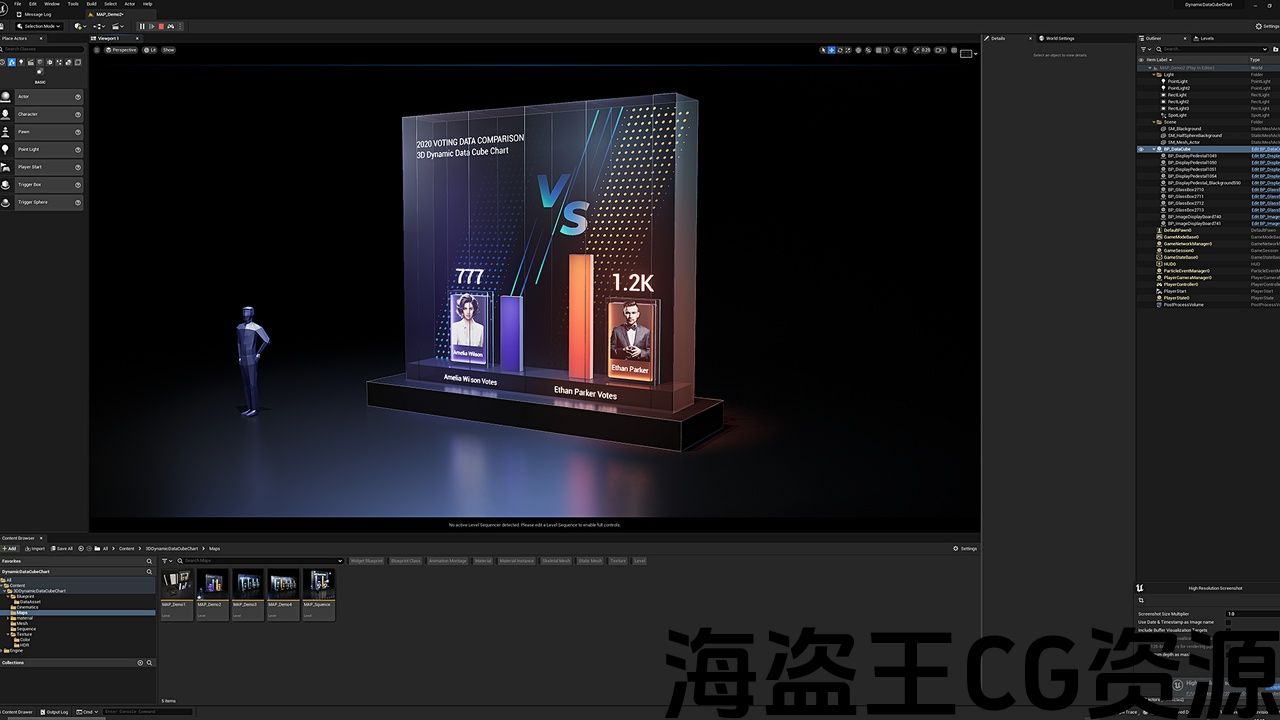
Overview: “3D Dynamic Data Cube Chart” is a dynamic 3D data visualization tool asset designed for real-time presentation of data. Assets include two modes of presenting data: percentage and voting. With its intuitive data cube chart, this tool allows you to quickly use it in data visualization projects and virtual studios out of the box.
Feature Highlights:
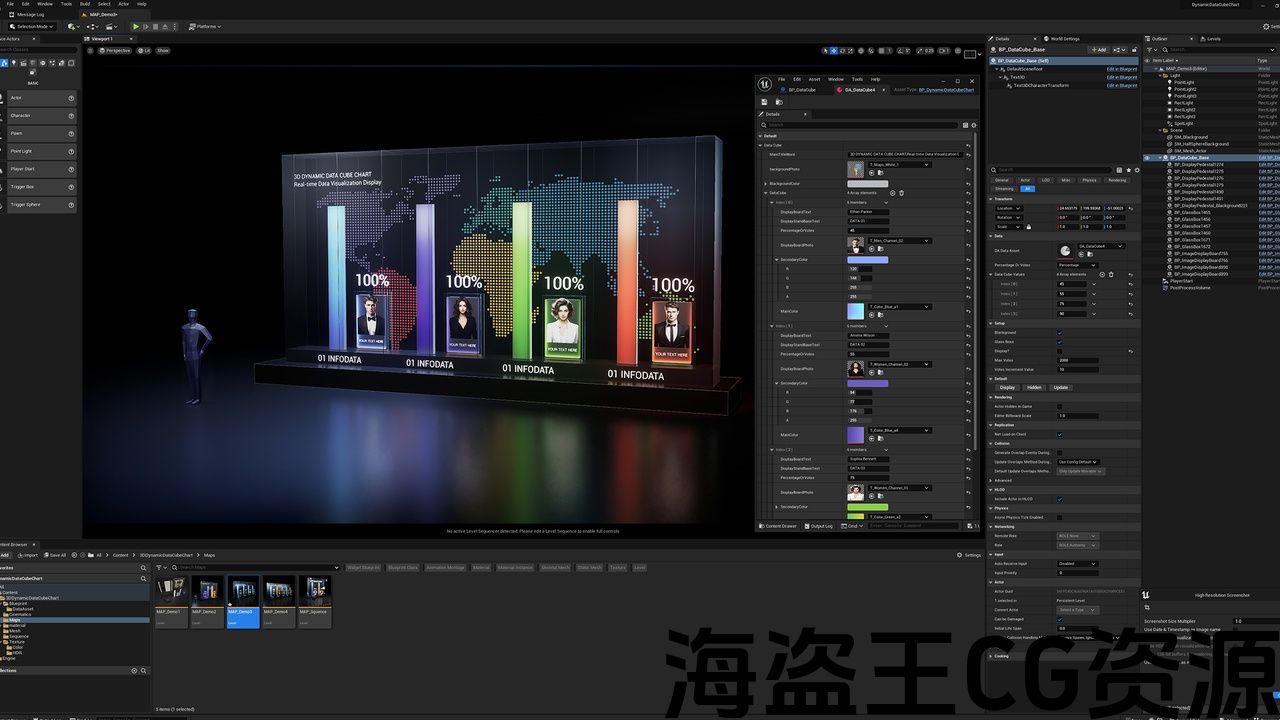
Real-time data update: Modify data in real time and update with one click.
Customized experience: Provides rich customization options, including color, number of Data Cubes, pictures, and text.
Animation and visual effects: appearance, hiding, smooth transition animation.
Data interface functions facilitate the use of other methods to transfer data.
[演示视频vimeo] [演示视频bilibili] [产品文档]
注意:资源中的文本使用引擎”Text3D”插件。 此插件必须开启,否则会报错,无法正常使用。 建议先启用插件,然后将资源导入到项目中。
确保启用项目设置–>衬底材料,子不透明材料粗糙折射衬底高级可视化着色器.如果没有,材料是无用的。
概览: “3D动态数据立方体图表”是一种动态3D数据可视化工具资产,专为实时呈现数据而设计。 资产包括两种呈现数据的模式:百分比和投票。 凭借其直观的数据立方体图表,该工具可让您在开箱即用的数据可视化项目和虚拟工作室中快速使用它。
功能亮点:
*实时数据更新:实时修改数据,一键更新。
个性化定制体验:提供丰富的定制选项,包括颜色、数据立方体数量、图片和文字。
动画和视觉效果:外观,隐藏,平滑过渡动画。
数据接口功能便于使用其他方法传输数据。
评论(0)