Features:
-
Beginner-Friendly UI
-
Performance & Rendering Insights
-
Custom Command Execution
Number of Blueprints: 4
Input: Mouse & Keyboard
Network Replicated: No
Runtime: Yes
Supported Development Platforms:
-
Windows: Yes
-
Mac: Yes
Documentation Link: Link
Features:
-
Beginner-Friendly UI
-
Performance & Rendering Insights
-
Custom Command Execution
Number of Blueprints: 4
Input: Mouse & Keyboard
Network Replicated: No
Runtime: Yes
Supported Development Platforms:
-
Windows: Yes
-
Mac: Yes
Documentation Link: Link
🎬FEATURES | 📚DOCUMENTATION | 🌐WEBSITE | 💬DISCORD
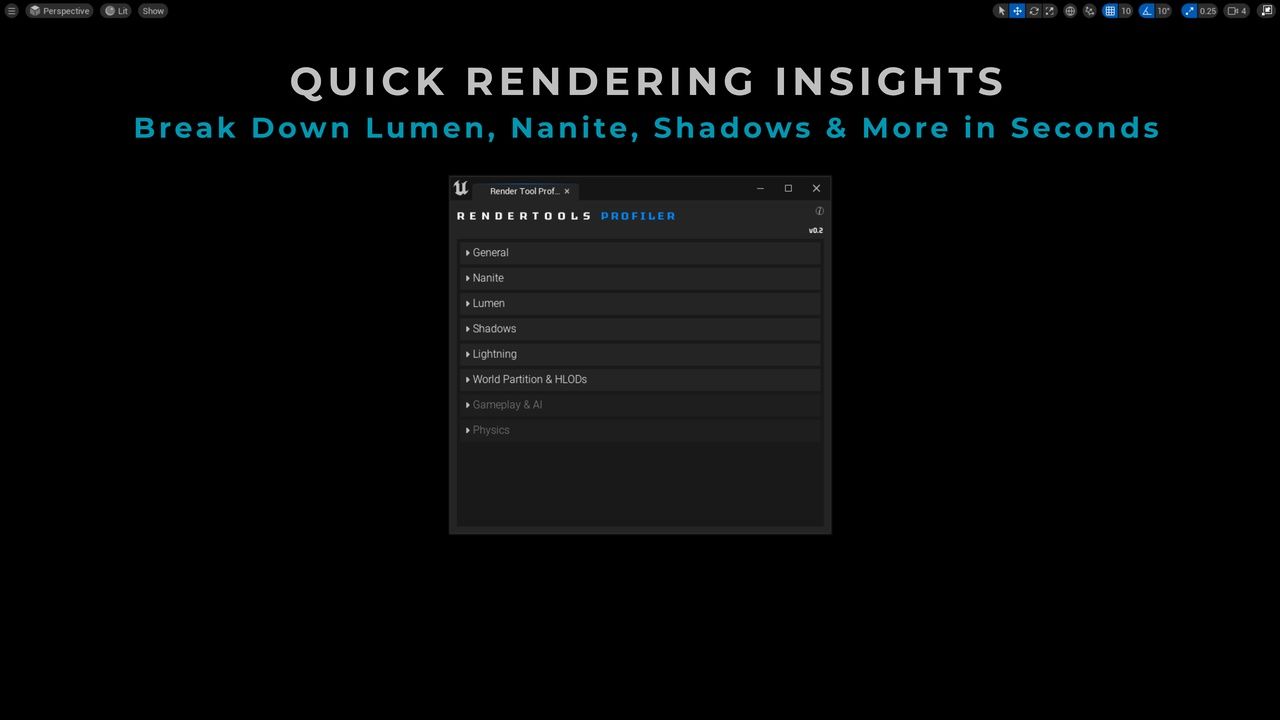
RenderTools: Profiler – Analyze & Debug Rendering Performance
Streamline your performance analysis with RenderTools: Profiler – the essential toolkit for artists, tech artists, and developers looking to identify and fix rendering issues faster inside Unreal Engine 5. This tool brings together real-time insights, debug views, and optimization metrics in one easy-to-use interface.
🔍 Key Features
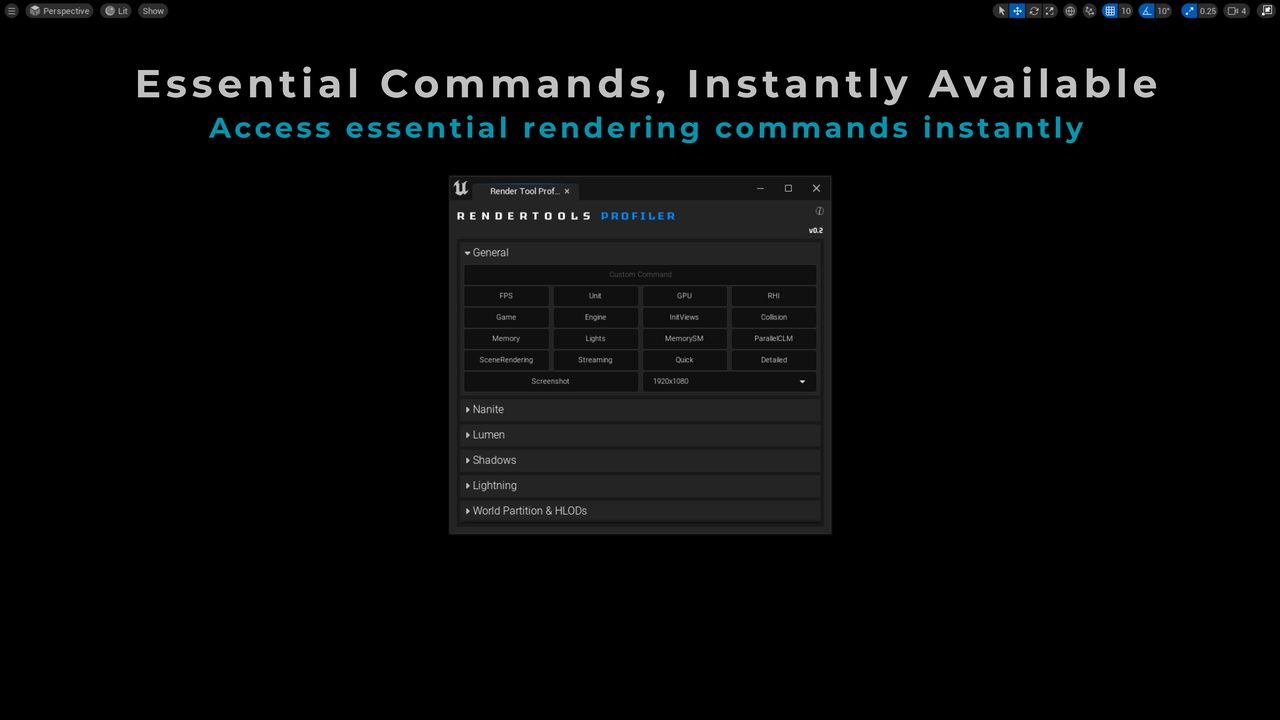
✅ One-Click Stat DebuggingToggle essential rendering stats like stat SceneRendering, stat GPU, stat InitViews, and many more – without typing console commands.
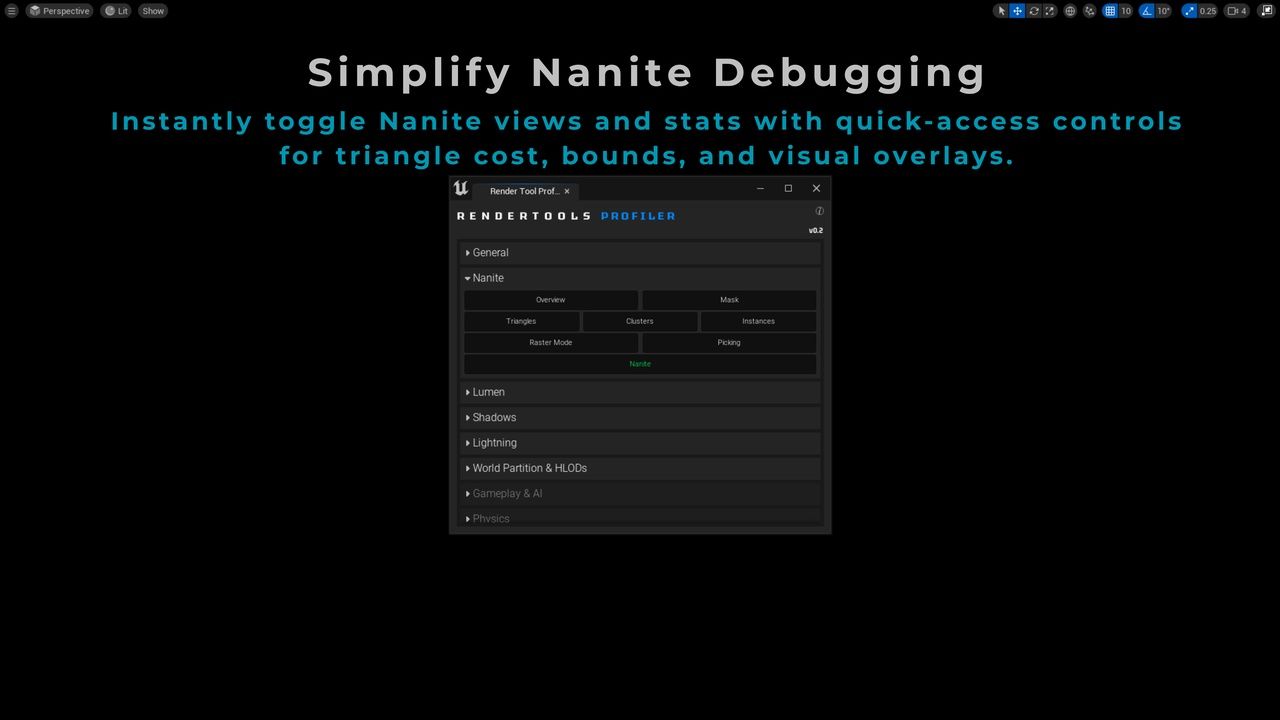
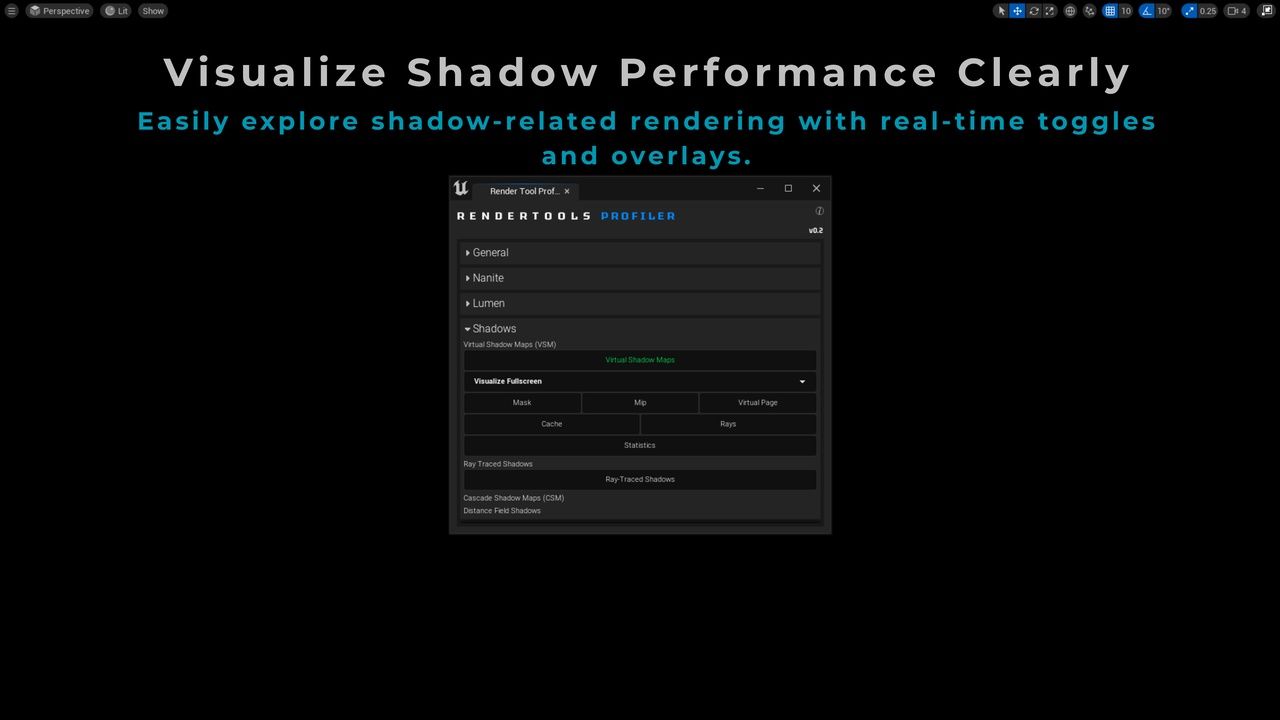
✅ Performance Overlays & View ModesInstantly enable optimization-focused view modes like Light Complexity, Lumen Overview, Nanite Triangles, Virtual Shadow Maps, and Distance Fields – ideal for debugging lighting and overdraw.
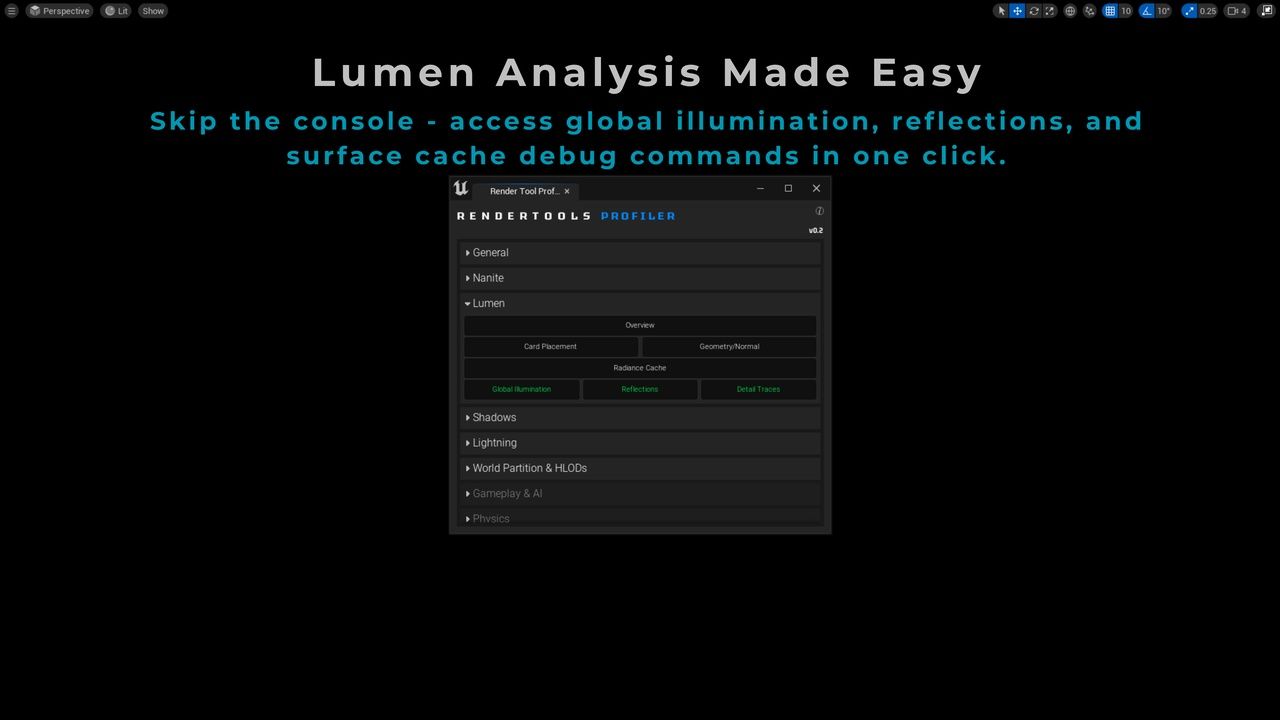
✅ CVar Control Without the ConsoleQuickly change critical rendering CVars (e.g., Lumen reflections, shadow quality, r.Shadow.Virtual.EnableCulling) through dropdowns and sliders – no more guessing syntax.
✅ Category-Based OrganizationAll stats, view modes, and CVars are grouped into clean categories like Lighting, Shadows, Nanite, Lumen, and Mesh Optimization for intuitive access.
✅ Level Artists + Programmers Love ItDesigned to help technical artists, level designers, and programmers quickly collaborate and optimize scenes without interrupting each other’s workflows.
🧪 Technical Details
Built entirely in Blueprint, plug-and-play with no code required.
Compatible with Unreal Engine 5.1+ (Lumen, Nanite, VSM).
Organized with Editor Utility Widget (EUW) for minimal performance overhead.
🎯 Ideal Use Cases
Lighting optimization and overdraw debugging
Mesh complexity and Nanite triangle analysis
Performance testing across scalability levels
Teaching Unreal Engine optimization workflows
RenderTools are used by 500+ developers worldwide.
📘 Docs & Support
Includes complete documentation with setup instructions and best practice tips.
Need help or want to suggest a feature? Reach out via Discord or email us at contact@rendrify.com
👉 Take control of your rendering pipeline. Start debugging smarter with RenderTools: Profiler.
🎬FEATURES | 📚DOCUMENTATION | 🌐WEBSITE | 💬DISCORD
RenderTools: Profiler – Analyze & Debug Rendering Performance
Streamline your performance analysis with RenderTools: Profiler – the essential toolkit for artists, tech artists, and developers looking to identify and fix rendering issues faster inside Unreal Engine 5. This tool brings together real-time insights, debug views, and optimization metrics in one easy-to-use interface.
🔍 Key Features
✅ One-Click Stat DebuggingToggle essential rendering stats like stat SceneRendering, stat GPU, stat InitViews, and many more – without typing console commands.
✅ Performance Overlays & View ModesInstantly enable optimization-focused view modes like Light Complexity, Lumen Overview, Nanite Triangles, Virtual Shadow Maps, and Distance Fields – ideal for debugging lighting and overdraw.
✅ CVar Control Without the ConsoleQuickly change critical rendering CVars (e.g., Lumen reflections, shadow quality, r.Shadow.Virtual.EnableCulling) through dropdowns and sliders – no more guessing syntax.
✅ Category-Based OrganizationAll stats, view modes, and CVars are grouped into clean categories like Lighting, Shadows, Nanite, Lumen, and Mesh Optimization for intuitive access.
✅ Level Artists + Programmers Love ItDesigned to help technical artists, level designers, and programmers quickly collaborate and optimize scenes without interrupting each other’s workflows.
🧪 Technical Details
Built entirely in Blueprint, plug-and-play with no code required.
Compatible with Unreal Engine 5.1+ (Lumen, Nanite, VSM).
Organized with Editor Utility Widget (EUW) for minimal performance overhead.
🎯 Ideal Use Cases
Lighting optimization and overdraw debugging
Mesh complexity and Nanite triangle analysis
Performance testing across scalability levels
Teaching Unreal Engine optimization workflows
RenderTools are used by 500+ developers worldwide.
📘 Docs & Support
Includes complete documentation with setup instructions and best practice tips.
Need help or want to suggest a feature? Reach out via Discord or email us at contact@rendrify.com
👉 Take control of your rendering pipeline. Start debugging smarter with RenderTools: Profiler.
评论(0)